Shift Vector Settings
These setting control the display of Shift Vectors.
The contour map is a graphic way of displaying the trends in the differences in the two layers.
The contours are generated by first building a triangular mesh over all of the matched points.
If there is any discontinuity in the data such as a mis-matched point, it will show up as a “whirl-pool” in the contours.
These can be changed using the edit option.
Display Shift Vectors
Tick this to display the shift vectors on the screen.
The Shift Vectors are shown as a blue arrowed line from the Shift point to the Reference Point.
This mimics what will happen if the Shift Vactor was applied to the Shift point.
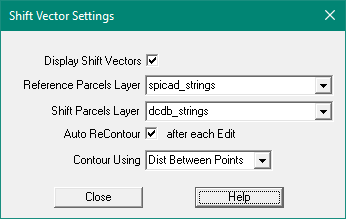
Reference Parcels Layer
Set this to the layer containing the Reference strings.
These are the strings in the correct position and the correct shape).
Shift Parcels Layer
Select the Layer for the parcels to be shifted
Auto ReContour after each Edit
The shift amounts can be displayed as 'contours' which will visually highlight large shifts and help
you detect and eliminate errors.
Tick this box to turn on the contours, they will be re-computed after each edit you make.
Contour Using
Contours of the shift distances will be drawn to help you identify problems.
Enter your preferred contour method, usually 'Dist Between Points'
The contour interval will be 200 mm.
Compute Shift Vectors
Edit Shift Vectors
Shift Vector Settings
Read Shift Vectors file
Write Shift Vectors file
Write Shift Vectors to an FME format file
Write Shift Vectors to an ESRI format file